Visualization tip: color palette
Scenario: we have data from multiple experiments. The experiment names are joint by project name and auto-incremented task id. The number of records in each task varies, and the number of tasks in each project also varis. We want to plot a boxplot to examine the distribution but would like to color boxes from same project as the same. To do so we need to set the palette argument.
import pandas as pd
import numpy as np
import seaborn as sns
import matplotlib
import itertools
%matplotlib inline
vals = []
for proj in list("ABC"):
    offset = np.random.randint(0, 5)
    for task_id in range(np.random.randint(2, 5)):
        vals.extend([
            (f"{proj}_{task_id}", v) for v in np.random.random(np.random.randint(5, 10)) + offset
        ])
df = pd.DataFrame(vals, columns=["experiment", "value"])
df.sample(5)
| experiment | value | |
|---|---|---|
| 12 | B_0 | 4.565408 |
| 30 | B_2 | 4.971167 |
| 1 | A_0 | 2.569001 |
| 25 | B_1 | 4.304160 |
| 35 | B_3 | 4.443520 |
df.experiment.value_counts()
B_0    9
C_0    9
B_1    8
A_1    7
B_3    7
C_1    7
B_2    6
A_0    5
C_2    5
Name: experiment, dtype: int64
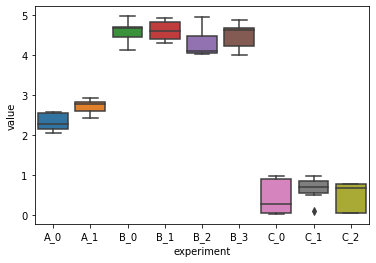
A straight forward seaborn boxplot without palette:
sns.boxplot(data=df, x="experiment", y="value")
<AxesSubplot:xlabel='experiment', ylabel='value'>
Now set the palette. When passing a list type palette argument for seaborn.boxplot, the length should be same as the plot’s x-ticks, which is the size of unique values for the x.
- Sort the DataFrame to make sure records are properly ordered by experiment names. You can never be too cautious when dealing with manually assembled data.
- Select a palette using
color_palette. - Assign
paletteargument usingnp.searchsorted()to locate proper index in the palette.
df = df.sort_values(by="experiment")
proj = df["experiment"].str.slice(0, 1)
col_pal = sns.color_palette(n_colors=len(proj.unique()))
pal_ind = np.searchsorted(proj.unique(), df.experiment.unique()) - 1
pal = [col_pal[i] for i in pal_ind]
sns.boxplot(data=df, x="experiment", y="value", palette=pal)
<AxesSubplot:xlabel='experiment', ylabel='value'>
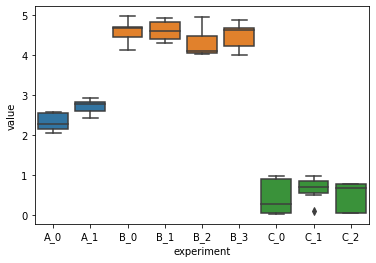
Here the trick is np.searchsorted(a, v, side='left', sorter=None). Its docstring: “Find indices where elements should be inserted to maintain order.” We use this method to place the unique experiment names in the project name list.